Monitoring: Grafana, Loki, Prometheus, Alertmanager
Most of the times I evaluate tools or libraries I get disappointed: Bugs in the most common features, missing the simplest of use-cases, bad documentation, etc.
So that's why I've decided to write a praise to Grafana and Loki, which I've both heavily enjoyed to set up and use.
See my repo with a fully running setup here: andreas-mausch/grafana-prometheus-loki-alertmanager-setup
1. Background
I've used the ELK stack at AWS before (Elasticsearch, Logstash, Kibana), and maybe my setup contained errors, but the user experience in general was awful for me. Searches took long time (>20sec), I didn't like the filtering much and from time to time the server crashed on pretty much basic queries.
Now in my current project I was looking for alternatives. I knew Grafana from a previous project, but never set it up myself (we had a dedicated Ops team there).
So this was now my first time to set up Grafana myself. I will not go into too much details, you will find an excellent documentation at Grafana Labs. Instead, I will just write down steps I've handled differently.
Spoiler: I ended up with a solution where I can search the logs from all our services full-text within <3seconds and I have alerting on logs which contain words like 'error' or 'exception'.
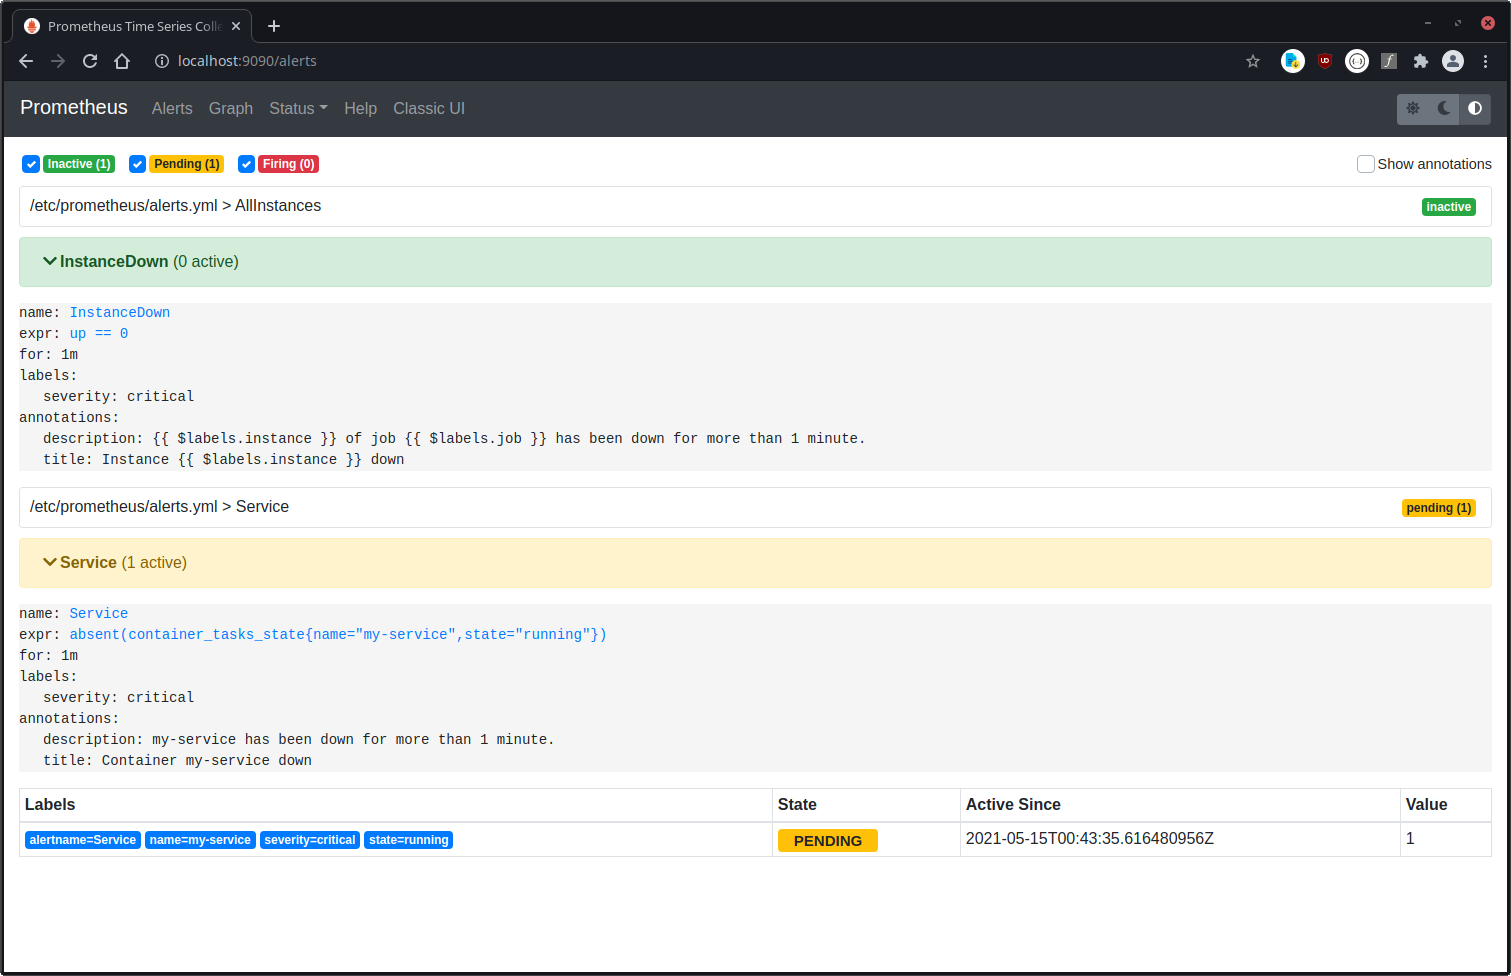
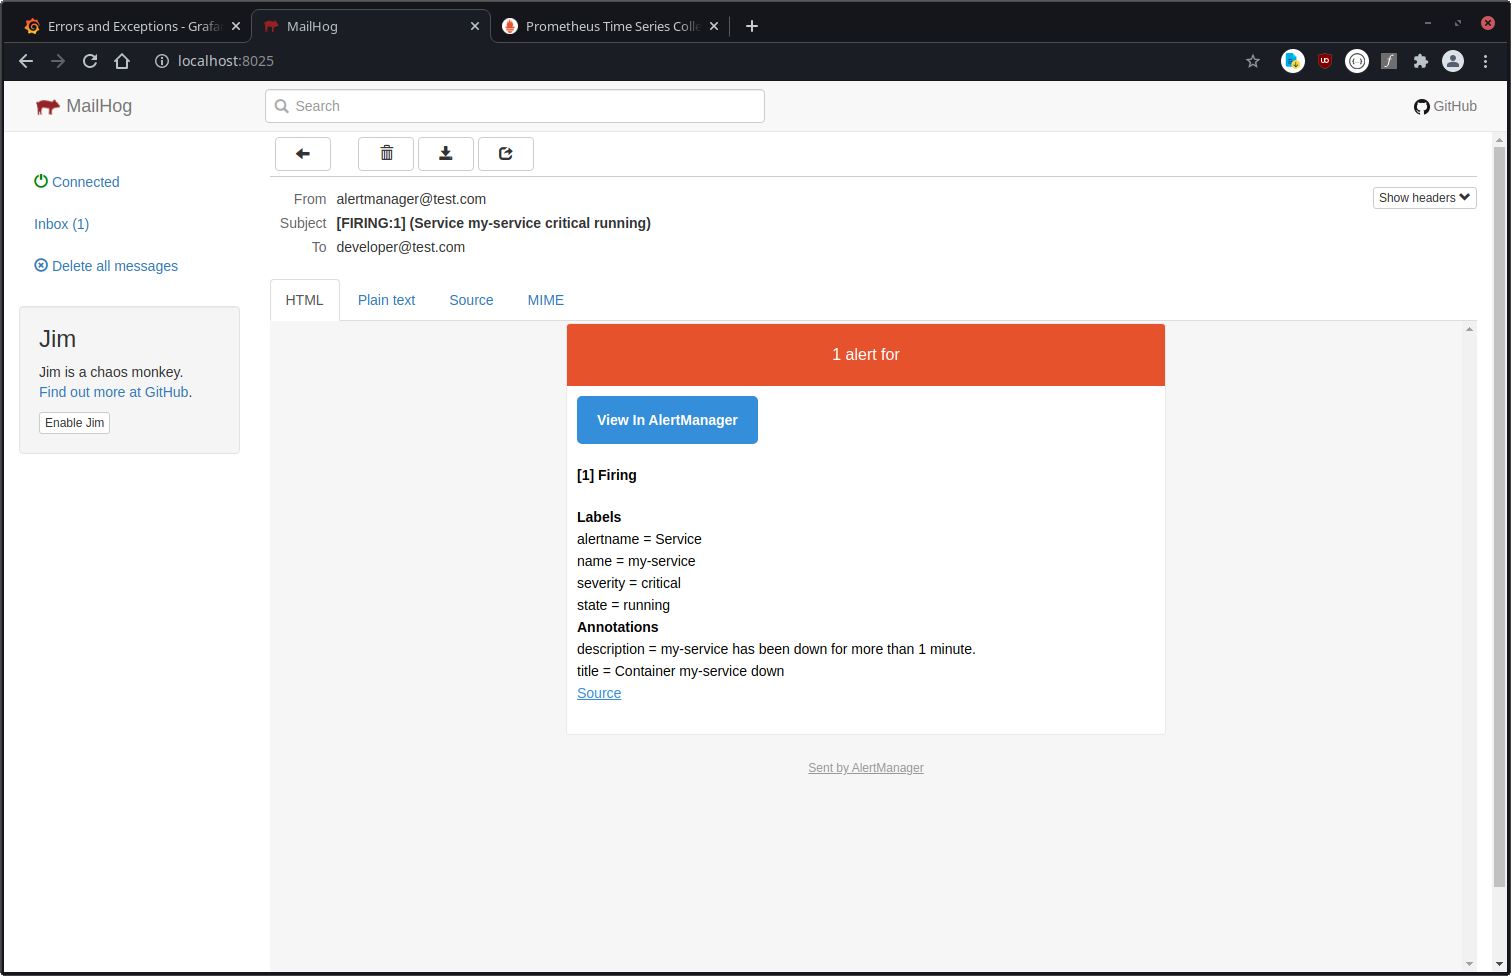
2. Prometheus, Alertmanager
Both of them were already set up before. We use cadvisor to get notified whenever a docker service has problems. One thing I'm really missing here is the healthcheck (see the issue here), but beside that it works well.
3. Loki, Docker Driver
Loki runs as a simple docker container and the docker plugin sends the logs from the containers to the loki server.
The alternative to the docker driver would be Promtail, which reads log files from a specified directory and forwards them to Loki.
3.1. Configuration
For docker swarm users: Unfortunately, there is no setting to configure the log-opts per docker stack, only per service. So you need to either set them globally, or duplicate them at each container.
The changes I made to the default config file (/etc/loki/config.yaml) was the connection to the alertmanager and the persistence settings (see below). Also, I've added a /etc/loki/rules/alerts/rules.yml for the alerting.
3.2. Permission
loki_1 | level=error ts=2021-05-14T16:19:26.017663788Z caller=log.go:106 msg="error initializing bucket client" err="mkdir /data/loki/chunks: permission denied"I can find two issues for this error, but they have been closed already. I still have this problem though.
My (ugly) workaround: Let run loki as root.
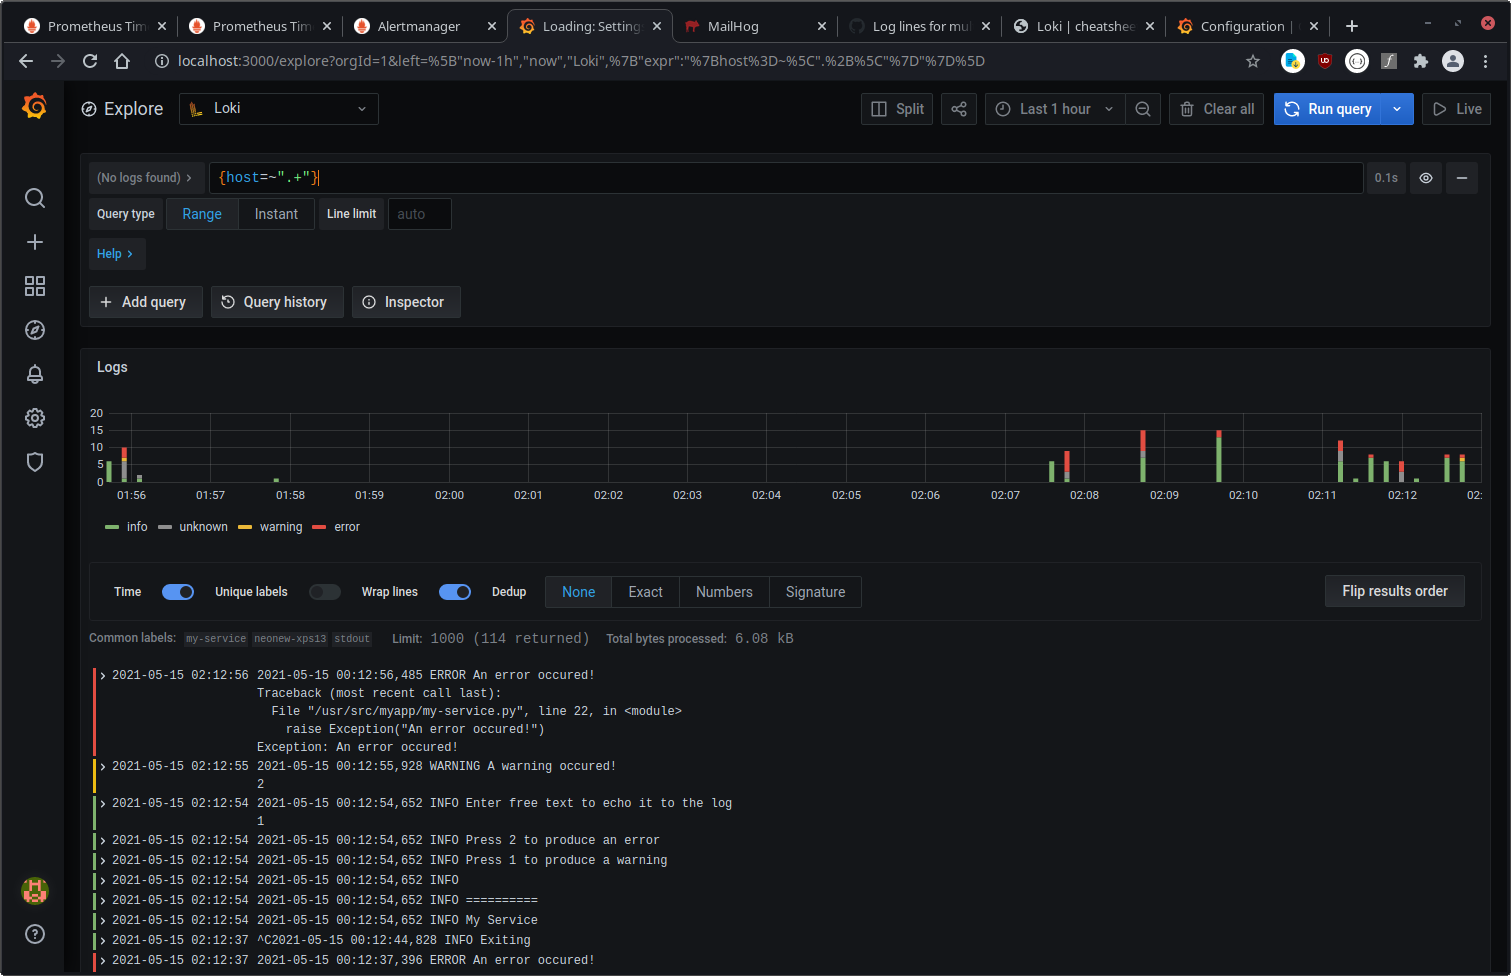
4. Grafana
Grafana has two data sources: Prometheus and Loki.
You can search for log entries and also see all Prometheus metrics in Grafana. Nice.
4.1. Authentication
We use a Keycloak server for user authentication, and it was easily possible to connect Grafana to it via their OAuth settings.
One note here: You configure four URLs in Grafana: auth_url, token_url, api_url and signout_redirect_url. Our Grafana container has no access to the internet, and therefore we couldn't use the public keycloak URL in all cases. That would have required some proxy configuration at least.
But there is a difference in the URLs: Some of them are called by the user's browser, and some of them are called by the Grafana container!
So only auth_url and signout_redirect_url are called by the user, and they need to be publicly available URLs. token_url and api_url can be set to URLs only accessible in the local network (they should lead to the same Keycloak server though).
4.1.1. User exists in Keycloak, but has no grafana role
Currently, Grafana cannot deny access to an authenticated user.
He will at least get the Viewer role.
But in the latest unreleased version there is a fix already: role_attribute_strict.
See here and here.
I will be available in version 8.0.0.
4.1.2. My auth settings for Grafana
[auth]
disable_login_form = true
oauth_auto_login = true
signout_redirect_url = https://keycloak.mycompany.com/auth/realms/my-realm/protocol/openid-connect/logout

[auth.anonymous]
enabled = false

[auth.generic_oauth]
name = Keycloak
enabled = true
client_id = grafana
client_secret =
scopes = openid profile email
email_attribute_name = email:primary
role_attribute_path = "roles[*] && contains(roles[*], 'admin') && 'Admin' || roles[*] && contains(roles[*], 'editor') && 'Editor' || roles[*] && contains(roles[*], 'viewer') && 'Viewer' || 'Forbidden'"
role_attribute_strict = true
auth_url = https://keycloak.mycompany.com/auth/realms/my-realm/protocol/openid-connect/auth
token_url = http://keycloak.intranet/auth/realms/my-realm/protocol/openid-connect/token
api_url = http://keycloak.intranet/auth/realms/my-realm/protocol/openid-connect/userinfo

# Logging for debugging OAuth Token
[log]
filters = oauth:debug oauth.generic_oauth:debug
Use the debug log to analyze errors, display the token etc.
These two links were helpful:
- https://www.lars-fischer.me/posts/2021/grafana-sso-integration-with-keycloak/
- https://janikvonrotz.ch/2020/08/27/grafana-oauth-with-keycloak-and-how-to-validate-a-jwt-token/
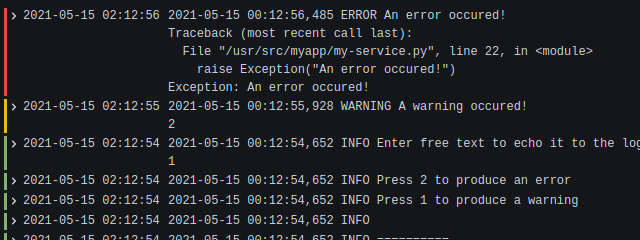
5. Multiline
One feature which is pretty essential in my opinion and is only available since March 2021: multiline stages.
Your Java application might produce a single (multi-line) log event for an Exception, but the docker logs handle them just as separate single lines. So Loki cannot easily decide which blocks of lines belong together. That's why you can set up the multiline stage and tell Loki a regex pattern which your log entries start with, for example a timestamp. Loki will then group these lines again and Grafana can display them together.
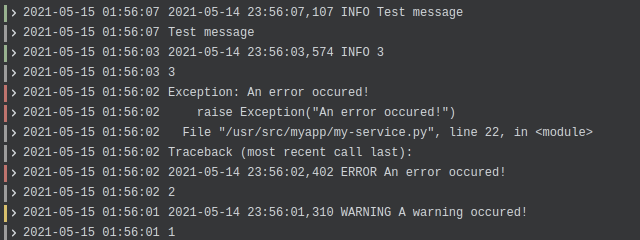
6. Colors
A special note here: If you use colored output for your log files, you need to include the hex codes in the regex.
I've used this '^\d{2}:\d{2}:\d{2},\d{3}' regex and was surprised it didn't match the following line:
13:37:00,123 Test output
That's because I had colored logs configured with logback:
%cyan(%d{HH:mm:ss.SSS}) %gray([%thread]) %highlight(%-5level) %magenta(%logger{36}) - %msg%nThis leads to the first character not being a 1, but the hex value 0x1B (or \033 octal): The ASCII Escape character
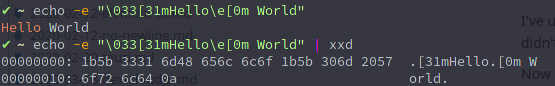
So in order to filter by the colored output, I've used this regex:
^\x1B\[36m\d{2}:\d{2}:\d{2},\d{3}7. Persistence
When playing around with loki and restarting the service a couple of times, I've noticed I lost log entries.
7.1. Ingester, Write-Ahead Log
Some investigation, and I found that the ingester only persists logs every few minutes. This can be configured, at chunk_idle_period for example.
Now, there is a good blog post at Grafana Labs where they explain how to not lose data.
It's pretty recent (Feb 2021), because the feature is just available.
Here: https://grafana.com/blog/2021/02/16/the-essential-config-settings-you-should-use-so-you-wont-drop-logs-in-loki/
I'm still wondering how these can not be the defaults settings though. :(
I'm also wondering how the WAL config is not mentioned anywhere on their
example config page.
So please enable the Write-Ahead Log (WAL) and make sure the directory is persisted, for example in a docker volume. Check my loki config for an example.
I've ran into this error, which could be easily fixed by doing what the error message suggests:
invalid ingester config: the use of the write ahead log (WAL) is incompatible with chunk transfers. It's suggested to use the WAL. Please try setting ingester.max-transfer-retries to 0 to disable transfersStrange: The docu talks about a --ingester.recover-from-wal setting.
--ingester.recover-from-walto true to recover data from an existing WAL. The data is recovered even if WAL is disabled and this is set to true. The WAL dir needs to be set for this. If you are going to enable WAL, it is advisable to always set this to true.
I couldn't find it anywhere (even browsed the sources), so I did not use it.
7.2. Retention
And last, I've set the loki retention_period to 14 days to get rid of old logs and keep the disk usage low.
Note: There are two retention times. One for loki, and one for Prometheus. Prometheus setting is named storage.tsdb.retention.time and defaults to 15 days. I haven't changed the value.
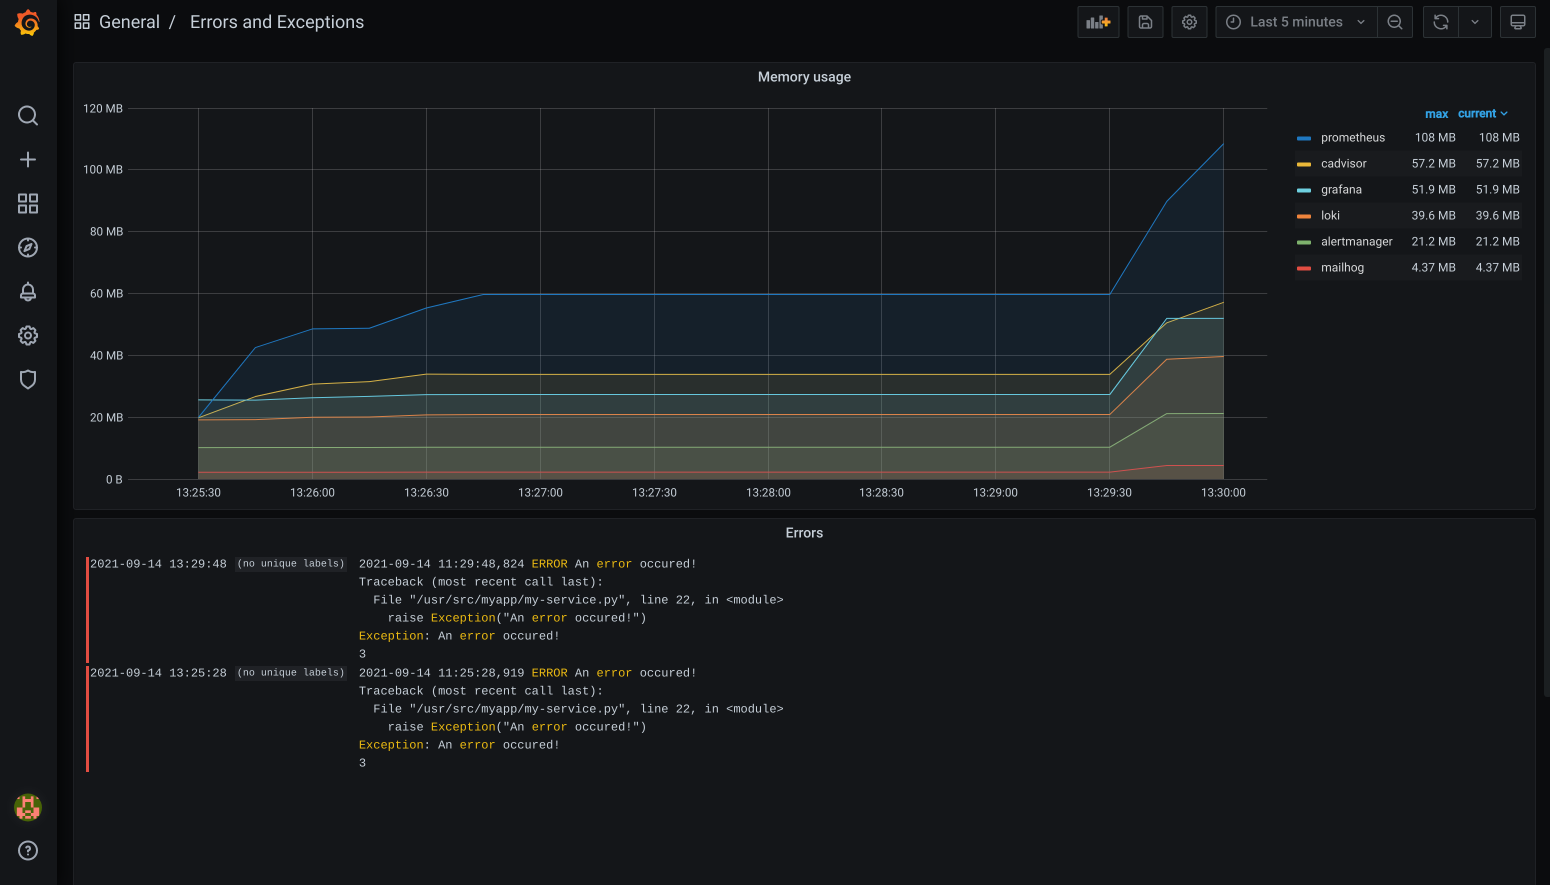
8. Memory usage
I've updated the grafana dashboard to also display the memory usage per docker compose service. Data comes from cadvisor.
The Prometheus query is this:
sum by (container_label_com_docker_compose_service) (container_memory_usage_bytes{container_label_com_docker_compose_service=~".+"})In case you use docker swarm, you can use container_label_com_docker_swarm_service_name instead of container_label_com_docker_compose_service.
9. Grafana Loki update: 2.2.1 -> 3.2.0
A lot of things changed here, which made this update a bit of a hassle.
- Schema update: v11 -> v13
boltdbreplaced bytsdbenforce_metric_namehas been deprecated link- retention is now done by compactor instead
table_manager/retention_periodmoved tolimits_configchunk_store_config/max_look_back_periodmoved tolimits_config/max_query_lookbacktable_manageris deprecatedenable_alertmanager_v2is the default nowmax_transfer_retriesis removed- Ingester WAL now defaults to on link
10. Grafana Alerting
Grafana's modern alerting system was introduced in version 8.0 as an opt-in feature and became the default in version 9.0. Grafana 9.0 was released on June 14, 2022.
Grafana Alerting replaces much of Alertmanager’s functionality, and you can drop Alertmanager if you're using Grafana 9.0+ with the unified alerting system.
You still need Alertmanager if other services beside Grafana send alerts.
11. Let Loki detect the log level
In order to filter for only warnings or errors, you can use a new configuration to automatically detect the log level.
For this, you need to enable allow_structured_metadata and discover_log_levels.
Both are enabled by default on newer installations.
Structured metadata requires schema v13 and the TSDB index type.
In my experience, the detection was not 100% reliable, and some lines beginning with
WARN: something went wrong would be detected as error.